Introduction
There are several tools available on the cluster to help you monitor jobs on the cluster. We will discuss some of them here. You can find more information on some convenient SLURM commands here.
squeue
The most basic way to check the status of the batch system are the programs squeue and sinfo. These are not graphical programs, but we will mention them here for comparison. We can check which jobs are active with squeue
[araim1@maya-usr1 ~]$ squeue
  JOBID PARTITION     NAME     USER  ST       TIME  NODES QOS    NODELIST(REASON)
   1389  parallel fmMle_no   araim1  PD       0:00     32 normal (Resources)
   1381  parallel fmMle_no   araim1   R      15:52      1 normal n7
[araim1@maya-usr1 ~]$
Notice that the first job is in state PD (pending), and is waiting for 32 nodes to become available. The second job is in state R (running), and is executing on node n7.
sacct
We can retrieve statistics for a completed job (no longer in the queue) using the sacct command.
[jongraf1@maya-usr1 ~]$ sacct -j 151111 --format=JobID,JobName,Partition,QOS,Elapsed,Start,NodeList,State,ExitCode
       JobID    JobName  Partition        QOS    Elapsed               Start        NodeList      State ExitCode
------------ ---------- ---------- ---------- ---------- ------------------- --------------- ---------- --------
151111        fq32_ch14      batch     normal   00:05:56 2015-03-10T14:14:45             n93  COMPLETED      0:0
151111.batch      batch                         00:05:56 2015-03-10T14:14:45             n93  COMPLETED      0:0
151111.0     run_scrip+                         00:05:55 2015-03-10T14:14:46             n93  COMPLETED      0:0
[jongraf1@maya-usr1 ~]$
Suspend/Resume all jobs
There are cases in which a user may desire to suspend all of their jobs currently runnning (including job arrays) This can be done with the command:
squeue -ho %A -t R | xargs -n 1 scontrol suspend
To resume the suspended jobs simply use the command:
squeue -o "%.18A %.18t" -u <username> | awk '{if ($2 =="S"){print $1}}' | xargs -n 1 scontrol resume
sinfo
We can see what’s going on with the batch system from the perspective of the queues, using sinfo.
[araim1@maya-usr1 ~]$ sinfo
PARTITION AVAIL  TIMELIMIT  NODES  STATE NODELIST
develop*     up      31:00      2   idle n[1-2]
long_term    up 5-01:00:00      1  alloc n3
long_term    up 5-01:00:00     31   idle n[4-84]
serial       up   23:30:00      1  alloc n3
serial       up   23:30:00     31   idle n[4-84]
parallel     up   23:30:00      1  alloc n3
parallel     up   23:30:00     31   idle n[4-84]
performan    up   infinite      1  alloc n3
performan    up   infinite     31   idle n[4-84]
[araim1@maya-usr1 ~]$
We can see that the two nodes (n1, n2) in the develop queue are idle. The other queues share nodes n3 – n84, and currently n3 is in use for a running job. By combining this with the Linux watch command, we can make a simple display that refreshes periodically. Try
[araim1@maya-usr1 ~]$ watch sinfo
and you will get the following display
Every 2.0s: sinfo        Tue Dec 29 12:24:55 2009

PARTITION AVAIL  TIMELIMIT  NODES  STATE NODELIST
develop*     up      31:00	    2   idle n[1-2]
long_term    up 5-01:00:00     82   idle n[3-84]
serial       up   23:30:00     82   idle n[3-84]
parallel     up   23:30:00     82   idle n[3-84]
performan    up   infinite     82   idle n[3-84]
Use ctrl-c to exit back to the prompt.
You can also customize the output of the squeue and sinfo commands. Many fields are available that aren’t shown in the default output format. For example we can add a SHARED field, which tells if a job allows its nodes to be shared, and a TIME_LEFT field which says how much time is left before the job’s walltime limit is reached.
squeue --format '%.7i %.9P %.8j %.8u %.2t %.10M %.6D %.8h %.12L %R'
  JOBID PARTITION     NAME     USER  ST       TIME  NODES  SHARED    TIME_LEFT NODELIST(REASON)
   1389  parallel fmMle_no   araim1  PD       0:00     32       0      4:00:00  (Resources)
   1381  parallel fmMle_no   araim1   R      15:52      1       0      3:44:08   n7
We’ve specified “%.8h %.12L”, in addition to some other standard fields, to obtain this output. For all available fields and other output options, see the squeue and sinfo man pages.
scontrol
SLURM maintains more information about the system than is available through squeue and sinfo. The scontrol command allows you to see this. First, let’s see how to get very detailed information about all jobs currently in the batch system (this includes running, recently completed, pending, etc).
[araim1@maya-usr1 parallel-test]$ scontrol show jobs
JobId=3918 Name=hello_parallel
   UserId=araim1(28398) GroupId=pi_nagaraj(1057)
   Priority=4294897994 Account=(null) QOS=(null)
   JobState=RUNNING Reason=None Dependency=(null)
   TimeLimit=00:05:00 Requeue=1 Restarts=0 BatchFlag=1 ExitCode=0:0
   SubmitTime=2010-02-13T18:31:55 EligibleTime=2010-02-13T18:31:55
   StartTime=2010-02-13T18:31:55 EndTime=2010-02-13T18:36:56
   SuspendTime=None SecsPreSuspend=0
   Partition=develop AllocNode:Sid=maya-usr1:17540
   ReqNodeList=(null) ExcNodeList=(null)
   NodeList=n[1-2]
   NumNodes=2 NumCPUs=11 CPUs/Task=1 ReqS:C:T=1:1:1
   MinCPUsNode=1 MinMemoryNode=0 MinTmpDiskNode=0
   Features=(null) Reservation=(null)
   Shared=OK Contiguous=0 Licenses=(null) Network=(null)
   Command=/home/araim1/parallel-test/openmpi.slurm
   WorkDir=/home/araim1/parallel-test
From this output, we can see for example that the job was submitted at 2010-02-13T18:31:55, has 11 tasks (NumCPUs) running on nodes n33 and n34, and its working directory is /home/araim1/parallel-test. One thing that’s missing is how many processes are running on each node. Fortunately, we can get this by specifying the “–detail” option.
[araim1@maya-usr1 parallel-test]$ scontrol show --detail JobId=3918 Name=hello_parallel
   UserId=araim1(28398) GroupId=pi_nagaraj(1057)
   Priority=4294897994 Account=(null) QOS=(null)
   JobState=COMPLETED Reason=None Dependency=(null)
   TimeLimit=00:05:00 Requeue=1 Restarts=0 BatchFlag=1 ExitCode=0:0
   SubmitTime=2010-02-13T18:31:55 EligibleTime=2010-02-13T18:31:55
   StartTime=2010-02-13T18:31:55 EndTime=2010-02-13T18:32:29
   SuspendTime=None SecsPreSuspend=0
   Partition=develop AllocNode:Sid=maya-usr1:17540
   ReqNodeList=(null) ExcNodeList=(null)
   NodeList=n[1-2]
   NumNodes=2-2 NumCPUs=11 CPUs/Task=1 ReqS:C:T=1:1:1
     Nodes=n1 CPU_IDs=4-7 Mem=0
     Nodes=n2 CPU_IDs=0-6 Mem=0
   MinCPUsNode=1 MinMemoryNode=0 MinTmpDiskNode=0
   Features=(null) Reservation=(null)
   Shared=OK Contiguous=0 Licenses=(null) Network=(null)
   Command=/home/araim1/parallel-test/openmpi.slurm
   WorkDir=/home/araim1/parallel-test
There is a lot of output, but notice the following lines:
- Nodes=n1 CPU_IDs=4-7 Mem=0
- Nodes=n2 CPU_IDs=0-6 Mem=0
This tells us that four processes are being used on node n1 (running on CPU cores 4, 5, 6, and 7), and seven processes are being used on node n2 (running on CPU cores 0, 1, 2, …, 6).
scontrol is a very versatile command, and we can also use it to get detailed information about the available nodes and queues (called “partitions” in SLURM).
[araim1@maya-usr1 parallel-test]$ scontrol show partitions
PartitionName=develop
   AllocNodes=ALL AllowGroups=ALL Default=YES
    DefaultTime=00:05:00 DisableRootJobs=NO Hidden=NO
   MaxNodes=UNLIMITED MaxTime=00:31:00 MinNodes=1
   Nodes=n[1-2]
   Priority=0 RootOnly=NO Shared=NO
   State=UP TotalCPUs=16 TotalNodes=2
...
[araim1@maya-usr1 parallel-test]$ scontrol show nodes | head -n 15
NodeName=n1 Arch=x86_64 CoresPerSocket=4
   CPUAlloc=0 CPUErr=0 CPUTot=8 Features=(null)
   OS=Linux RealMemory=24083 Sockets=2
   State=IDLE ThreadsPerCore=1 TmpDisk=39679 Weight=1
   Reason=(null)
...
See the man page for scontrol (“man scontrol”) for more details about the command, especially to help understand how to interpret the many fields which are reported. Also note that some of the features of the scontrol command, such as modifying job information, can only be accessed by system administrators.
smap
smap is similar to the previous commands, but a bit more interactive. It provides an ncurses graphical interface to the information. Try the command
[araim1@maya-usr1 ~]$ smap
to get a display of running jobs like the following

At the top, notice the symbols A, B, C, and “dot”, which illustate how jobs have been allocated on the cluster. There are 84 slots, corresponding to the 84 nodes currently deployed. The symbols A, B, and C correspond to the job descriptions below. A dot means that no job is running on that node. We can also see the queue perspective
[araim1@maya-usr1 ~]$ smap -Ds

This view is slightly misleading. There are two nodes devoted to the develop queue, but the remaining 82 do not belong exclusively to the performance queue. As we noted earlier, those 82 nodes are shared among the non-develop queues. This view also does not display running jobs.
If you would like the display to refresh periodically (say every 1 second) launch smap with the following
[araim1@maya-usr1 ~]$ smap -i 1
sview
Sview is an X-windows application, so you’ll need to set up your terminal to display graphics. See Running X Windows programs remotely for more information. Once your terminal is configured, you can start sview
[araim1@maya-usr1 ~]$ sview
By default, you’ll get the familiar jobs view

And you may also see the status of the queues
 The information shown is similar as in smap, except jobs are identified by color codes rather than ID symbols. In addition, we can also see queue usage in this display. In the example above however, all nodes are idle. The display automatically refreshes periodically.
dstat
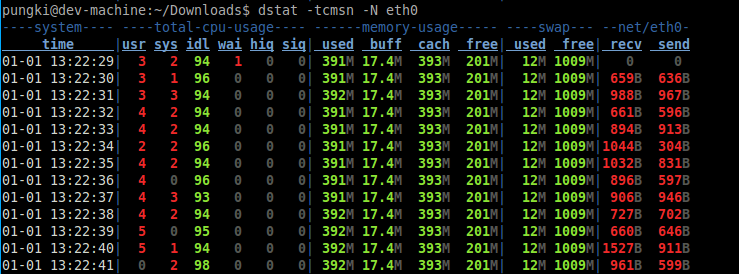
dstat is a versatile tool for accessing statistics on system resource statistics. You must first ssh into the node you want to monitor. To access information on cpu, memory, and ethernet usage please enter the following command:
$ dstat -tcmsn -N eth0

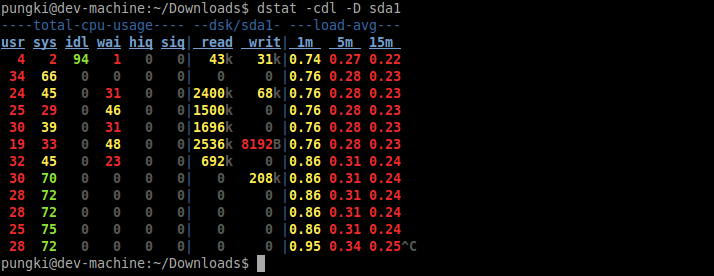
Show information about cpu, disk utilization and system load:
$ dstat -cdl -D sda1

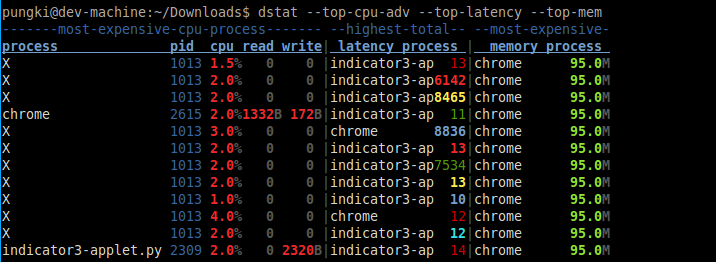
Show information about top cpu, top latency, and top memory:
$ dstat --top-cpu-adv --top-latency --top-mem

iostat
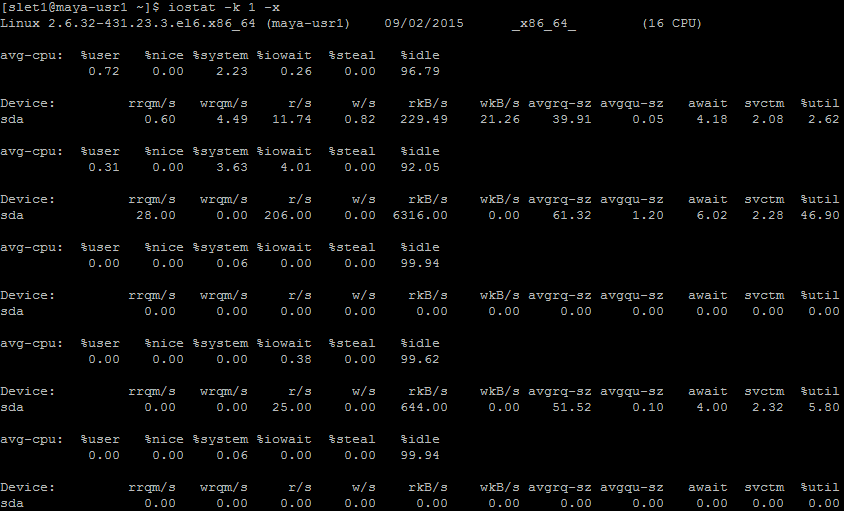
iostat is a command line tool that reports cpu statistics and input/output statistics for devices, partitions and network filesystems. You must first ssh into the node you want to monitor. The following command lists input/output statistics at any given moment:
$ iostat -k 1 -x

Ganglia
Ganglia is a higher level monitoring tool that let’s you see usage of the cluster. You can get an idea of the current usage, for example which nodes are currently down or how much memory is in use. You can also see historical information, like a graph of CPU load over the last month.
You can access the Ganglia webpage for maya here.